
USING SECTOR MOMENTUM AND INDEX CONSTRUCTION TO BUILD SMARTER EQUITY OVERWEIGHTS

Executive Summary
Broad market indexes are often treated as neutral starting points for equity allocation, but their construction rules create meaningful differences in sector exposure. Over the past decade, technology leadership has demonstrated how those differences can materially influence portfolio outcomes. The S&P 500, Nasdaq-100, and dedicated technology funds each captured the technology cycle differently because they held different companies, at different weights, under different eligibility rules.
This paper does not argue that investors should simply concentrate in the sector that performed best in the past. Instead, it examines a more practical portfolio-construction question: once an investor has a well-supported reason to overweight a sector, can index construction be used to express that view more deliberately and with broader diversification than a handful of individual stocks? The historical technology cycle offers a useful case study.
1. Sector leadership matters - but benchmark construction determines how much of it an investor captures
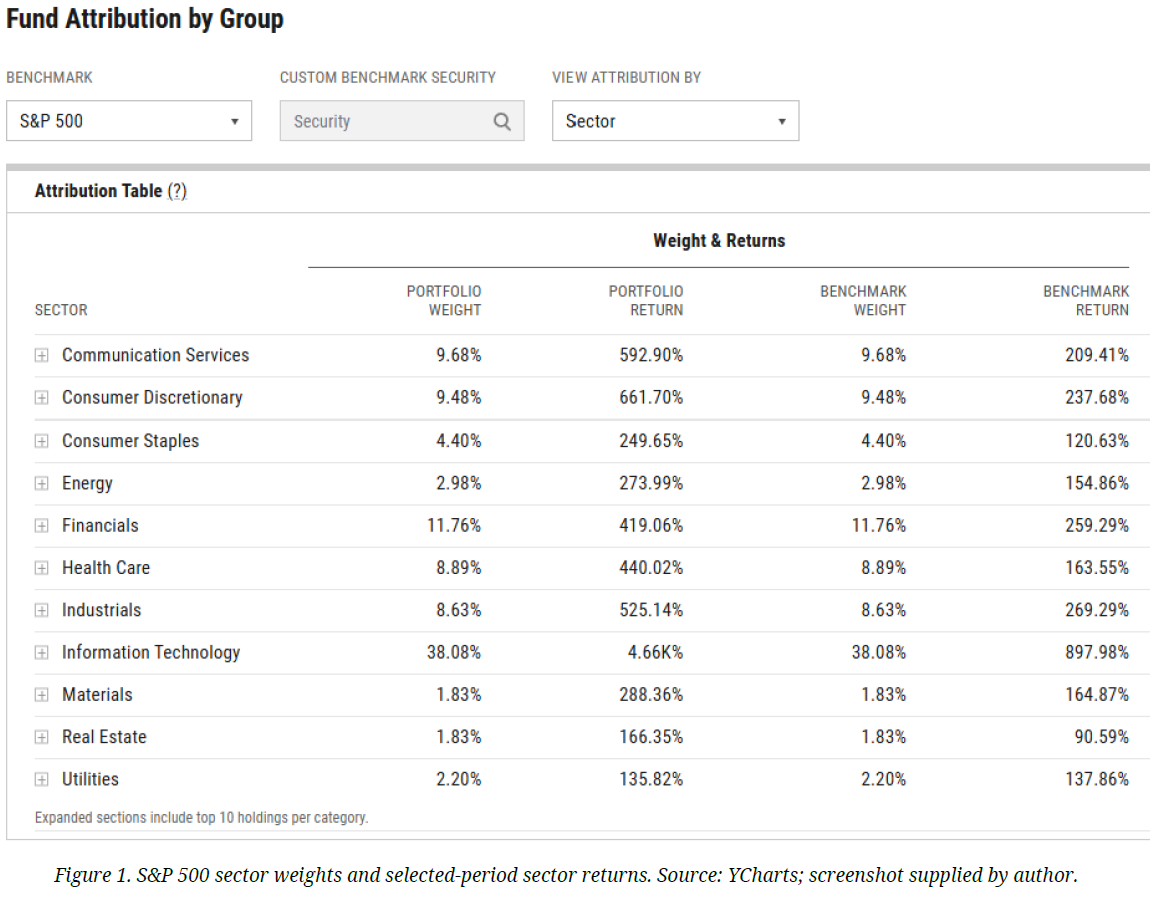
The starting point is the dispersion of returns within the S&P 500. In the attached YCharts analysis, Information Technology was the standout sector over the selected ten-year period, with a sector return shown at approximately 898%, while the other sectors displayed materially lower returns. The original research thesis correctly identifies that this matters for a capitalization-weighted index: when one sector and a relatively small group of companies become dominant sources of market appreciation, the benchmark's exposure to those winners can materially affect overall results.
Academic research provides context for why this effect can be so powerful. Bessembinder's work on U.S. equities found that long-run stock-market wealth creation has historically been highly concentrated in a small minority of companies.¹ That finding does not tell investors which companies will become future winners, but it does reinforce an important portfolio construction principle: eligibility rules, rebalancing rules, and portfolio weights influence how effectively an index participates in exceptional winners when they emerge.
2. The Nasdaq-100 illustrates how index design can create an intentional growth and technology tilt
The Nasdaq-100 provides a useful second step because its construction differs materially from the S&P 500. Nasdaq defines the index as 100 of the largest Nasdaq-listed non-financial companies, subject to its methodology and modified market-cap weighting rules.² The result is not a pure technology index, but it has historically carried substantially more exposure to technology and growth-oriented companies than the broad U.S. large-cap market.
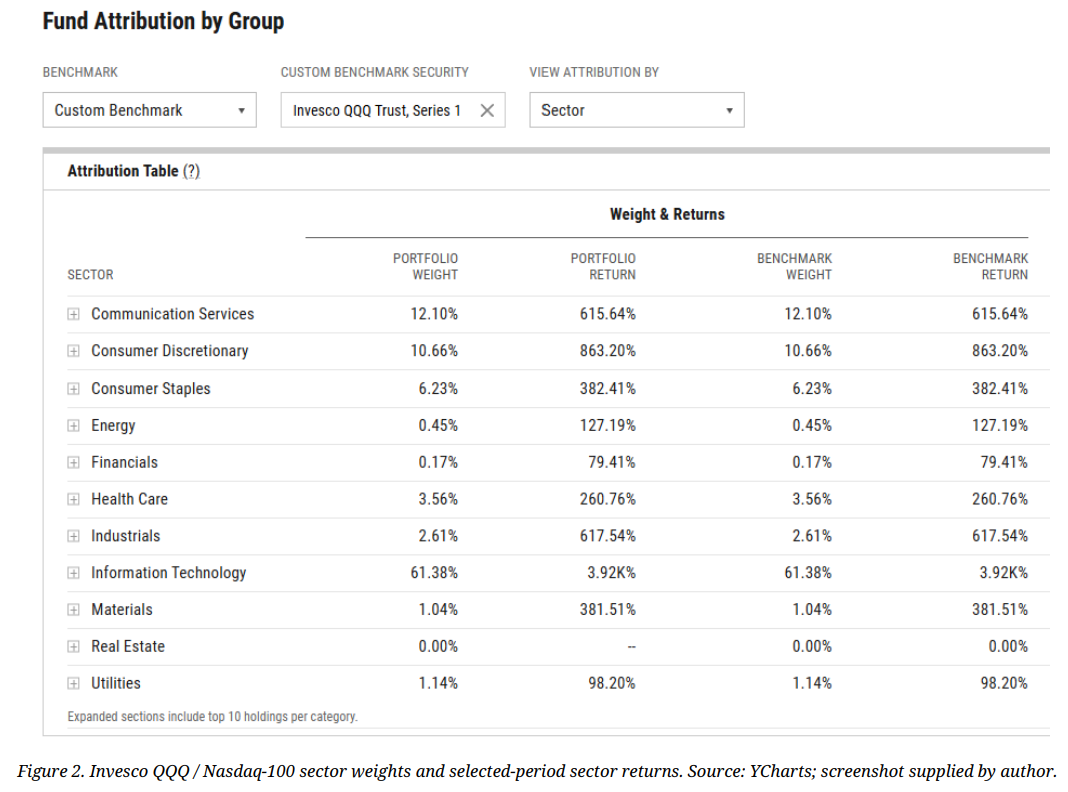
The supplied YCharts attribution makes that contrast visible. Information Technology represents approximately 61% of the QQQ analysis versus roughly 38% in the S&P 500 screenshot. The selectedperiod return shown for the Nasdaq-100's technology sector is approximately 3,920%. Several nontechnology sectors in the Nasdaq-100 analysis also produced strong returns. This is important because it suggests that benchmark differences are not reducible to a single mega-cap trade; the index's listing requirements, sector mix, and weighting methodology create a distinct opportunity set.
3. From market exposure to a deliberate sector overweight
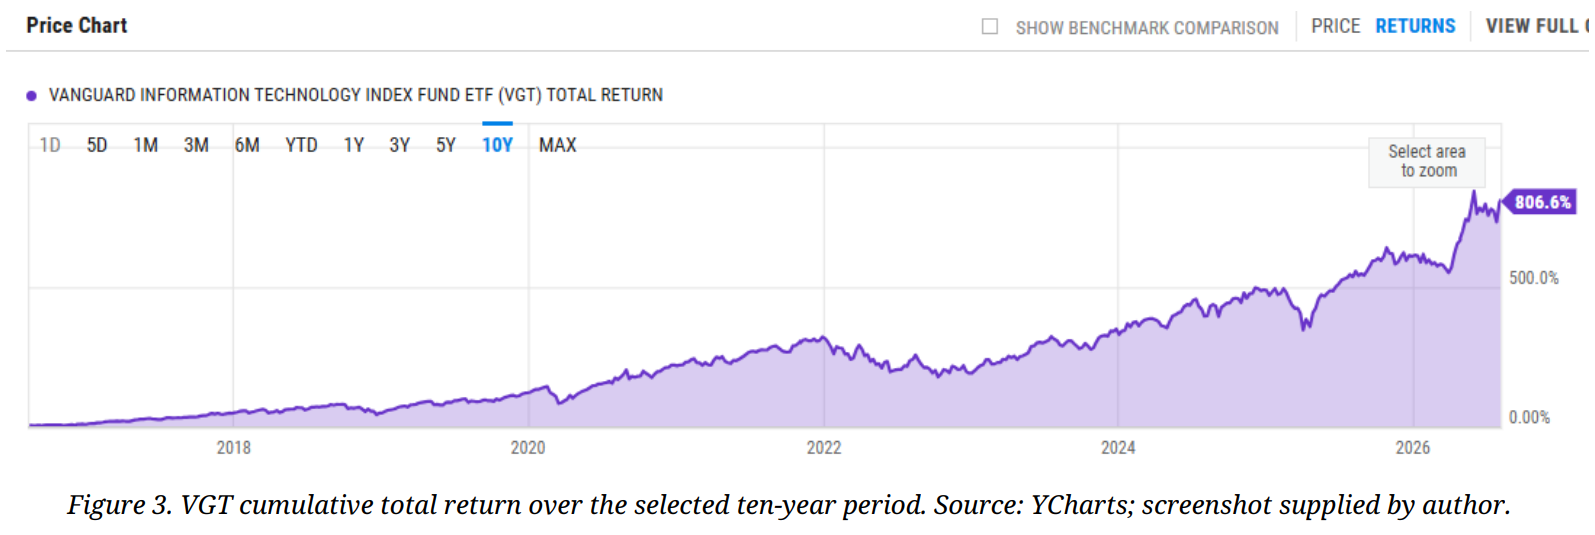
Once an investor determines that a sector overweight is appropriate, a dedicated sector index can provide a more direct implementation than relying on incidental exposure through a broad benchmark. Vanguard describes VGT as a passive ETF seeking to track an index of U.S. information-technology stocks.³ In the supplied YCharts chart, VGT produced cumulative total return of approximately 806.6% over the selected ten-year window.
The relevance of this comparison is not that a technology-only portfolio would have been 'better' in some universal sense. It is that the degree of sector exposure mattered enormously during a period of sustained technology leadership. A sector ETF can therefore be understood as a precision tool: it allows an investor to increase exposure to a chosen segment of the market without having to select a small group of individual winners. That can improve diversification within the chosen sector, although it simultaneously increases sector concentration relative to a broad-market portfolio.
4. Momentum can be an input to allocation - not a forecast
The idea of responding to persistent market leadership is not without empirical precedent. The academic momentum literature documents a historical tendency for securities with stronger recent performance to continue outperforming weaker performers over intermediate horizons. Jegadeesh and Titman's foundational work showed that strategies buying prior winners and selling prior losers generated significant historical returns in their sample.⁴ Subsequent research has also documented that momentum strategies can experience sharp reversals and periods of substantial underperformance.⁵
For portfolio construction, this distinction is critical. Momentum should not be interpreted as evidence that today's leading sector will remain the leader indefinitely. It is better viewed as one signal among several - alongside valuation, earnings growth, profitability, diversification, economic sensitivity, and an investor's existing exposures. A sector overweight based on sustained leadership can be rational, but the allocation should be sized with the possibility of regime change in mind.
5. Global index construction can broaden a sector thesis
A U.S.-only technology allocation may also leave out important parts of the industry's economic ecosystem. Semiconductor manufacturing, memory, foundry capacity, hardware, and equipment are global businesses. The iShares Global Tech ETF (IXN), for example, seeks to track an index composed of global technology equities and provides exposure across software, semiconductors, and hardware companies worldwide.⁶
This creates another layer of portfolio choice. An investor can express a technology view through a U.S. sector index, a global sector index, or a combination, depending on the exposures already present elsewhere in the portfolio. Geographic breadth may reduce reliance on the U.S. portion of the technology ecosystem, but it does not remove sector-specific risk. Technology funds remain exposed to valuation compression, industry cyclicality, regulatory change, currency movements, and the possibility that market leadership rotates elsewhere.
6. A particularly useful application: concentrated employer stock
The framework can be particularly relevant for investors whose portfolios already contain a large employer-stock position. A broad index may unintentionally add more exposure to the same company or to the same handful of mega-cap names. Conversely, a carefully selected sector index can sometimes provide exposure to the broader industry while limiting direct overlap with the concentrated holding.
Alphabet provides a useful illustration of the classification issue. Under GICS, Alphabet is classified in Communication Services rather than Information Technology. A dedicated information-technology ETF therefore provides exposure to many parts of the technology ecosystem without necessarily adding direct Alphabet exposure. This does not make such an ETF an automatic solution for an Alphabet shareholder; the entire portfolio, tax consequences, correlations, and underlying holdings still need to be evaluated. It does, however, show how index construction can be used deliberately rather than passively.
7. Portfolio framework: using indexes to express a sector overweight
A disciplined implementation can be thought of in layers. The broad-market allocation remains the portfolio's core. A sector view, where appropriate, is then expressed through an additional sleeve whose size reflects conviction and risk tolerance. The specific index is selected by examining what it actually owns: sector definitions, geographic coverage, concentration, weighting methodology, constituent eligibility, turnover, costs, and overlap with existing holdings.
This approach differs from chasing the best-performing fund. The objective is to choose the index whose construction most closely matches the intended exposure. In the technology example, the S&P 500 offers broad market participation with a large technology component; the Nasdaq-100 creates a stronger growth and technology tilt through a different constituent universe; VGT offers a direct U.S. informationtechnology allocation; and IXN broadens that sector exposure globally. Each can serve a different portfolio purpose.
8. Conclusion
The objective is not to identify which sector will outperform indefinitely. Sector leadership changes over time, and periods of strong momentum can reverse. The historical experience of the past decade instead illustrates how index construction can be used as a portfolio-building tool. Different indexes provide materially different exposures to industries, companies, geographies, and sources of return.
For investors who have identified a desired sector overweight, this creates alternatives to simply purchasing additional individual stocks. A broad-market allocation can remain the foundation of the portfolio while sector-specific or differently constructed indexes are used selectively to adjust exposure. In technology specifically, U.S. and global technology indexes can provide exposure across software, semiconductors, hardware, and other parts of the technology ecosystem rather than relying exclusively on a small number of mega-cap companies.
The same framework can be particularly relevant for investors who already have substantial exposure to an individual company through employer stock. In those circumstances, understanding the underlying holdings and classification rules of different indexes may allow an investor to seek broader participation in a favored sector while managing direct overlap with an existing concentrated position.
Historical sector momentum should therefore be viewed as an input to portfolio construction rather than a forecast. Valuation, diversification, risk tolerance, taxes, existing holdings, investment horizon, and the potential for changes in market leadership all remain important considerations. Sector overweights can increase volatility and tracking error relative to broad-market benchmarks and should be evaluated in the context of an investor's overall financial plan.
Methodology & compliance notes
Figures 1-3 are reproduced from YCharts screenshots supplied by the author and reflect the dates, classifications, benchmark settings, and return methodology selected in YCharts at the time of capture.
Sector 'return' fields shown in the attribution tables should not be interpreted as the percentage contribution of each sector to total portfolio return unless contribution to return is separately calculated. Cumulative and annualized returns are not interchangeable. Fund classifications and index methodologies can change over time.
This paper intentionally presents potential benefits alongside material risks and limitations. The SEC's Investment Adviser Marketing Rule prohibits materially misleading advertisements and requires fair and balanced treatment of material risks or limitations when potential benefits are discussed.⁷ Historical comparisons are therefore presented as case studies in portfolio construction rather than as projections of future performance.
References
1. Hendrik Bessembinder, “Do Stocks Outperform Treasury Bills?”, Journal of Financial Economics 129(3), 2018, pp. 440- 457.
2. Nasdaq Global Indexes, “Nasdaq-100 Index Methodology,” methodology effective May 1, 2026.
3. Vanguard, “Vanguard Information Technology ETF (VGT),” fund profile.
4. Narasimhan Jegadeesh and Sheridan Titman, “Returns to Buying Winners and Selling Losers: Implications for Stock Market Efficiency,” Journal of Finance 48(1), 1993, pp. 65-91.
5. Kent Daniel and Tobias J. Moskowitz, “Momentum Crashes,” Journal of Financial Economics 122(2), 2016, pp. 221-247.
6. iShares, “iShares Global Tech ETF (IXN),” fund profile.
7. U.S. Securities and Exchange Commission, “Investment Adviser Marketing,” Small Entity Compliance Guide; and Division of Examinations, “Initial Observations Regarding Advisers Act Marketing Rule Compliance,” April 17, 2024.
This content is for informational purposes only and should not be considered financial or investment advice. Please consult with a qualified financial professional regarding your unique situation. Past performance does not guarantee future results. Investments involve risk, including the potential loss of principal. This is not a solicitation to buy or sell securities.
Connect with Us Today
Schedule a free 30-minute consultation call. We’ll learn more about your priorities and ensure we can answer all of your questions.